What's new in HttpLogBrowser 4.0
You'll find hereafter the list of all new features in the free edition and the professional edition of the version 4 of the HttpLogBrowser. This version is currently still in beta.
Free edition
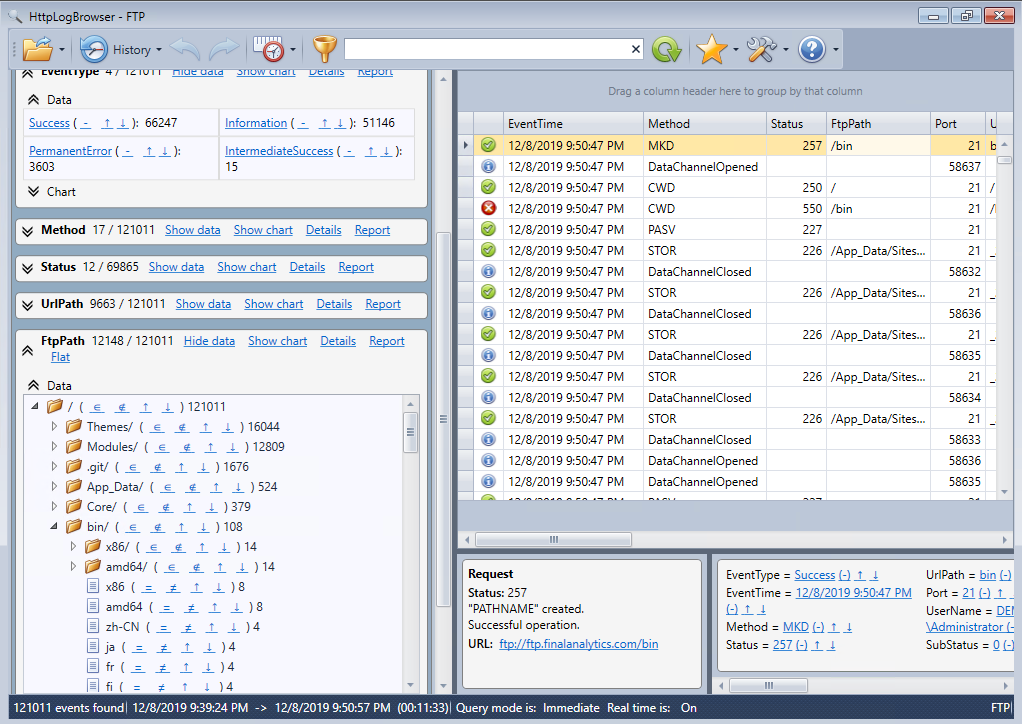
IIS FTP logs analysis
Despite the name of the application it was already possible to load logs from IIS FTP sites in previous versions. However the request status was interpreted as an HTTP status that has a different meaning.
Now the application will automatically detect if it is a FTP log and interpret the status accordingly. Additionally the field FtpPath (x-fullpath) can be analyzed in tree mode so you can see the FTP folder access statistics at a glance.
Local IIS sites log access
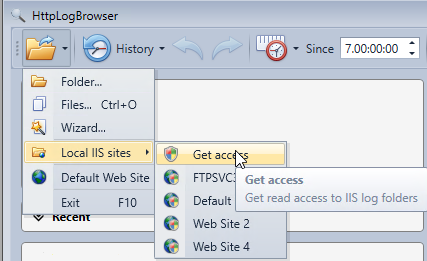
In the previous version you could already load logs from local IIS web sites directly from the menu if the application was installed on the web server. However as by default access to the log files requires privilege elevation (UAC) it was needed to change manually the log folder permissions before the application could access these logs without privilege elevation.
Additionally web sites were displayed with their number in the menu instead of their name.
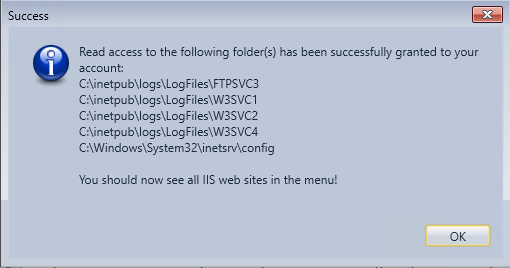
Now the application will automatically propose to change the permissions on the IIS log folders so you have permanent read access. You will also get read access to the IIS configuration folder so the application can retrieve the names of the web sites from the IIS configuration.
Hereafter, the load menu before getting read access
After a privilege elevation prompt, the read access to all required folders has been successfully granted.
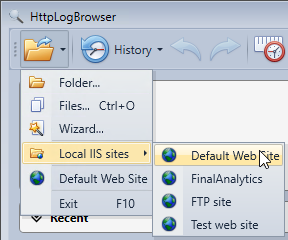
We now see the display name of all web sites in the menu and we can load the IIS logs without privilege elevation.
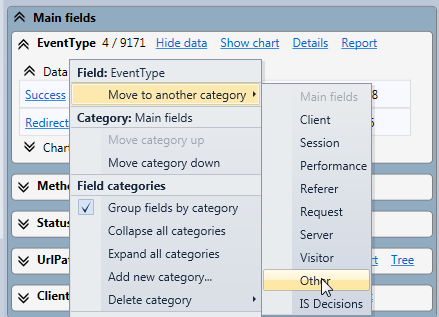
Field categories
There are many fields to dig in when analyzing HTTP logs but not all of them may be of interest for you and it was sometimes cumbersome to pick up the good one in the field statistics.
Now fields can be organized by categories with some default categories out of the box (Main fields, Client, Server, Performance, …)
So it’s now easier to browse all the fields and find the one you are interested in.
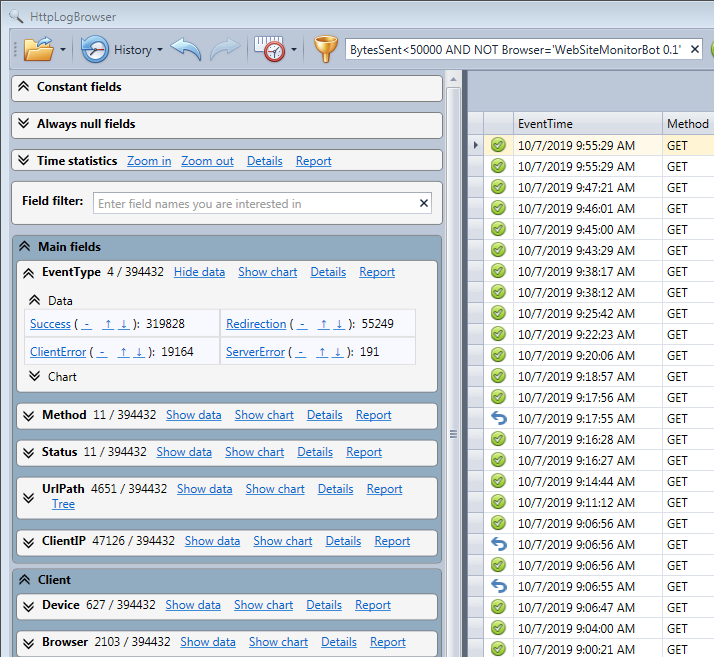
Additionally, with the field statistics context menu it’s possible to create your own categories and move fields from one category to another. This can be useful if you extract your own fields from the query parameters or from a cookie.
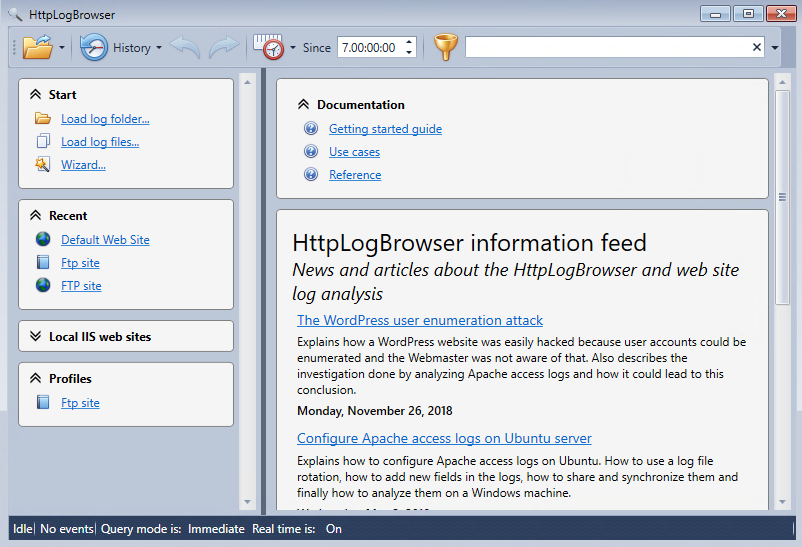
Welcome screen
Now, once the application is started you will be able to load log files directly from the startup screen with direct access to the recent items and the configured profiles.
You will also have quick access to the documentation, articles and news helping you use the application.
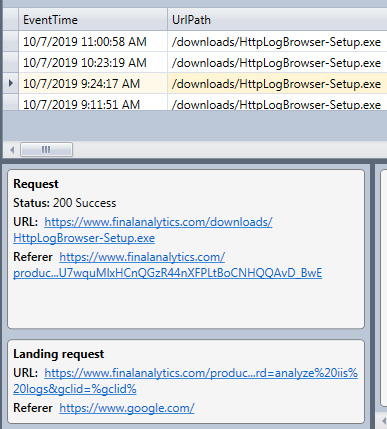
The landing request is displayed in the event panel
When the tracking field is enabled every log row keeps track of the first request done by the visitor. In many cases you are interested in knowing how the original referrer (web page from which the visitor came to your site) looks like. In the previous version you needed to do several filters before being able to display the landing request and then click on the referrer link in the event panel to show the page in a web browser.
Now the landing request with the original referrer are directly available in the event panel of every requests generated by the visitor. So it’s very quick to open in a web browser the web page the visitor came from.
Improved refresh
Previously it was needed to reload the whole log files to display newly available log rows. Now when a new filter is applied or the view is refreshed new log rows are automatically loaded and displayed without the need to reload rows already loaded. The Database mode is an exception and will still need a reload to get the new log rows.
Improved usability
When you apply a new filter, if the row selected before the refresh is still available in the new filter, it will be automatically selected so you can keep the position in the time line without the need to scroll down.
When applying a new filter the scroll bar of the field statistics panel will keep the same position so the same fields will remain visible. If you go back in the filter history, the same position than when you left the filter will be restored.
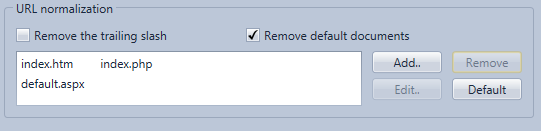
URL normalization
If URLs for a web site are not cannonical meaning that you can access the same page with several URLs you can normalize them with the following settings:
- Remove the trailing slash: For example http://www.mywebstie.com/folder/ will be considered as http://www.mywebstie.com/folder
- Remove default pages: For example if index.htm is the default page for a folder http://www.mywebstie.com/folder/index.htm will be considered as http://www.mywebstie.com/folder/
Portable installation
If you don't want to install the application on computers on which you need to use it you can use the portable installation that can be downloaded with the following link:
https://www.finalanalytics.com/downloads/HttpLogBrowser.zip
New settings
- If you are not comfortable with the way the application automatically shows/hides columns depending if their value is the same or not for all rows you can enable the setting Show/hide columns manually in the Preferences. Doing so your column selection will be persistent and you will get it back when you restart the application later.
- The new setting Number of top values also in the Preferences will allow you to customize the number of top values displayed in Top N charts (Top 5 by default).
Professional edition
Filter cache for the database mode
The database mode introduced in version 3 had one drawback. When going back in the filter history all log rows from the previews filtered view were loaded again from the database. As you will mostly use a database when you have a huge amount of log rows to analyze, it could be very cumbersome.
Now the database mode will keep the 20 last filtered views in memory so it will be almost instantaneous to go back in the filter history.
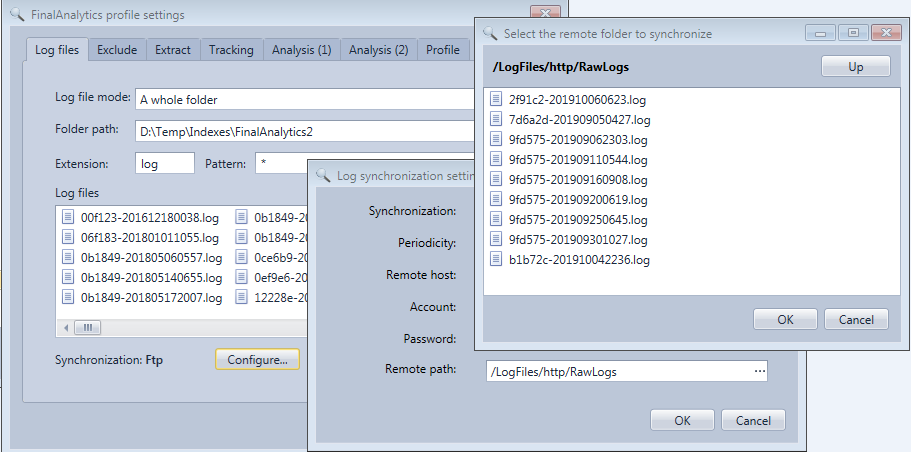
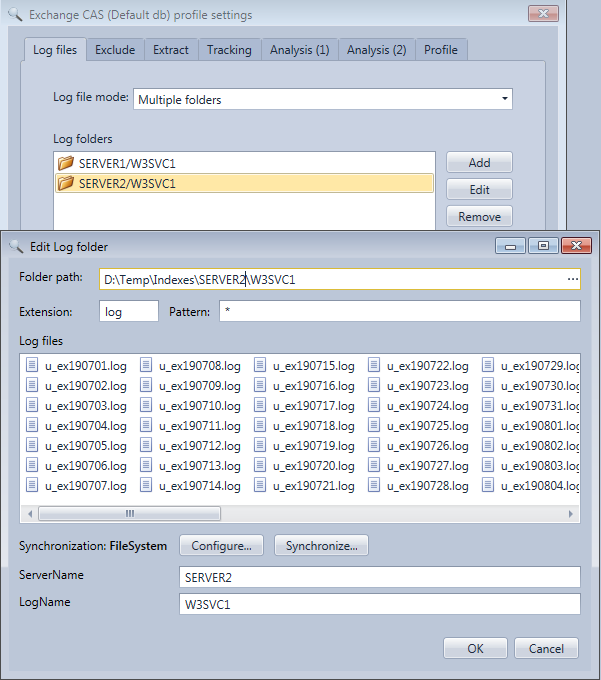
Browse remote log folders to synchronize
You can now browse remote log folders available through FTP, SFTP or the File system when you want to configure the synchronization of a log folder to your workstation. So it’s very easy to test the connectivity and pick up the good remote path.
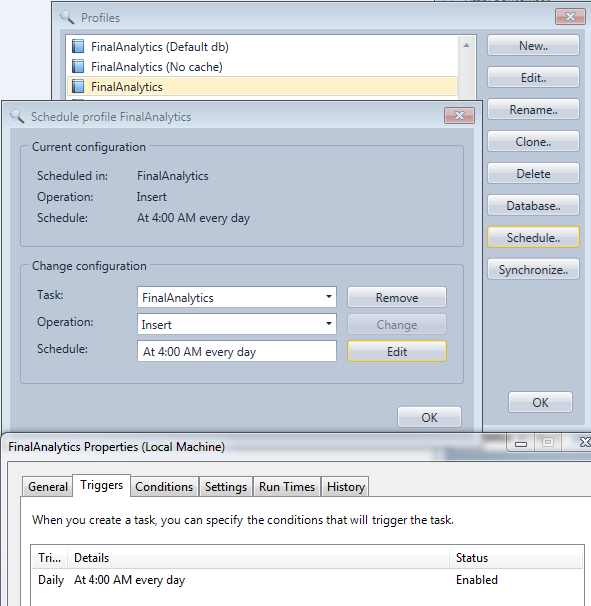
Ability to schedule log synchronization and insertion from the UI
In the previous version there was already the command line mode allowing you to schedule the log synchronization and database insertion. However it was needed to build the command line manually and schedule it with the Windows scheduler.
Now with the integrated scheduler you just need to select the concerned profile in the Profiles view, click Schedule, select a name for the scheduled task, select the operation and choose the time schedule through an identical interface as the Windows scheduler.
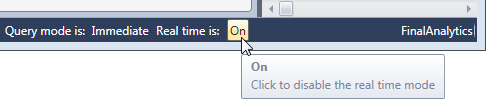
Real time mode
If the application is installed on the web server and a web site log folder is loaded in Normal or in Cache mode new rows will be automatically displayed once they are available in the file. It’s not instantaneous because IIS flushes new log rows in the log file only every minute but you will no longer need to click on Refresh.
If instead the application is installed on your workstation and the loaded log folder is synchronized with a remote web server by using When loaded as periodicity, the synchronization will take place every two minutes and new log rows will be displayed shortly after each synchronization.
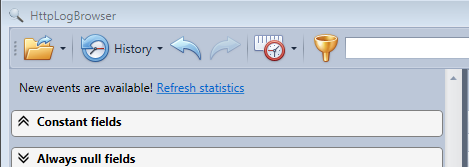
Once new log rows are displayed by the real time mode, statistics get out of sync but a link in the top of the field statistics panel will allow you to refresh those if needed.
If needed the real time mode can be disabled/enabled from the status bar.
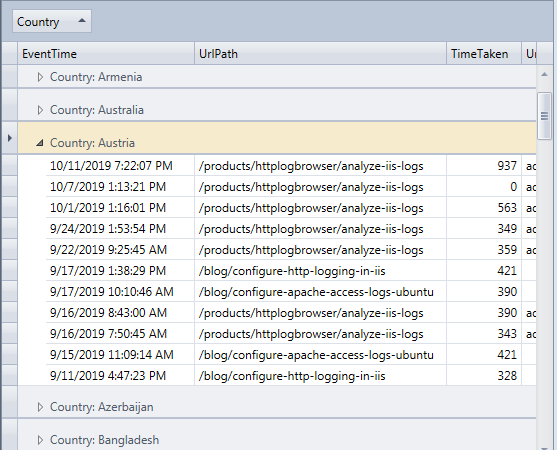
Multiple log folder mode
If you had a web site load balanced over several servers you could only analyze logs separately for each server on previous versions of the HttpLogBrowser. So you couldn’t have an overall view of the web site activity.
Now thanks to the multiple folders mode you can select the folders of all instances of the web site in order to combine them. Additional fields either automatically or manually configured will still allow you to know on which server or web site instance the request took place.
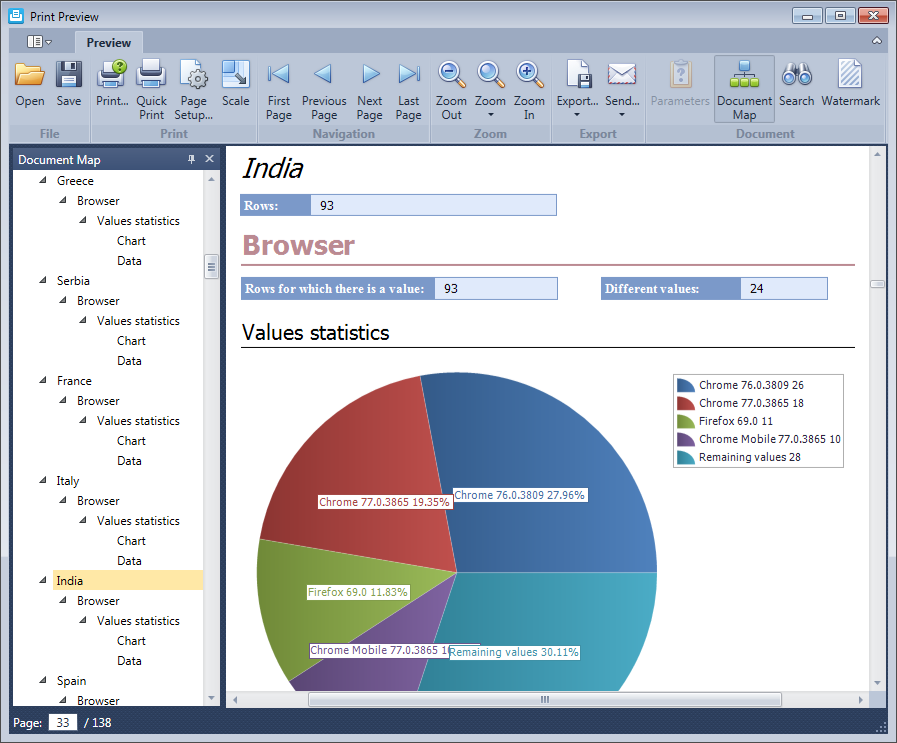
Improved rows grouping
The data grid where log rows are displayed already had the ability to group rows by a specific field just by dragging the column header in the group panel. However the grouping was lost after each refresh or new filter.
Now the top most grouping field will be kept after every new filter and if you generate a field statistics report it will also be grouped with this field.
Minor changes
The default filter to apply was moved to the Profile tab of the HTTP log configuration dialog so it can be configured for read only database profiles.