Analyze IIS HTTP logs with the HttpLogBrowser
Goal
- In the IIS web server, the web requests activity can be stored in HTTP log files located by default in a folder like C:\inetpub\logs\LogFiles\W3SVC%
- The HttpLogBrowser is a Windows desktop application with a free edition that can read and parse those logs to load them for viewing and analysis.
Load and view log files
- You can load either individual log files or the whole log folder of an IIS web site.
- During the parsing process some web requests can be ignored and new fields can be extracted like the client browser or a tracking cookie.
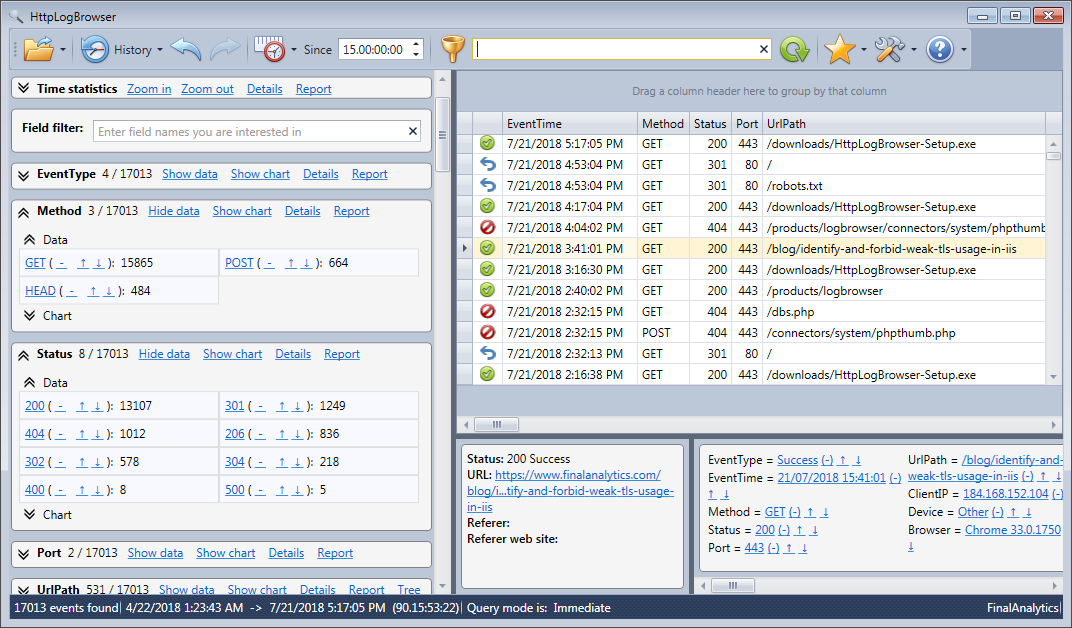
- Once loaded you can view the log rows in a data grid
- And statistics are displayed for every field.
Filter log rows
- In the statistics you can click on a value to automatically filter down the view and only display log rows matching this value.
- Every time you click on a value the new filter is added to the existing filter.
- Every filter is kept in the filter history so you can easily go back to a previous filter.
- The filter expression is automatically built in SQL syntax. If needed you can build your own custom SQL filter expression.
Time statistics
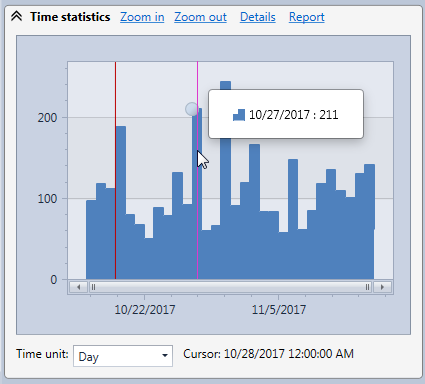
- In the Time Statistics chart, you can see the evolution of the web requests frequency to locate peak activity.
- You can then zoom in a specific period of time to only display log rows in this period and see more precisely what’s going on.
- If you double click on a specific position in time in the chart, the nearest corresponding log row will be automatically highlighted in the data grid allowing you to see concerned web requests.
- Counterwise if you change the selected log row in the data grid a red cursor will automatically move in the Time Statistics chart allowing you to visualize the position in time of the web request.
Charts
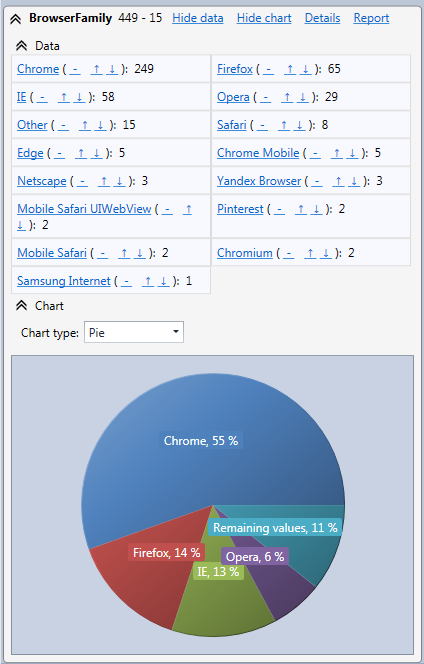
- Field statistics can be displayed in pie charts.
- A double click on slices also allows you to filter down log rows.
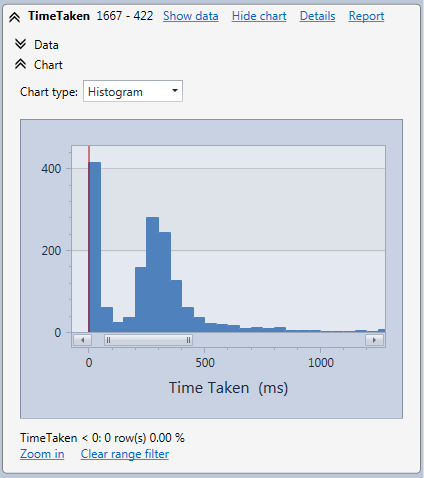
- For numeric fields the chart is an histogram.
- For example the time taken field histogram allows you to see in how much time (ms) web request are proceed by your web server.
Full feature list - Screenshots - Help
You can also read the review on Softpedia.