Configure Apache access logs on Ubuntu server
All my previous articles were about how to configure HTTP logs in IIS. It’s now time to see how to monitor the web site activity on an Apache web server running on Linux. The article is based on an Ubuntu installation on which a web site is running. We’ll see in this article how to configure the Apache access logs to facilitate archiving and synchronization of the log files. We’ll then see how to add useful additional fields and how to share the log files to be easily downloadable and synchronized from a remote workstation. Finally we’ll see how we can analyze these logs on a Windows workstation.
Presentation of the environment
You’ll find hereafter how the Ubuntu server was prepared for this article. If you have a configuration a little different it should not be a problem.
-
Ubuntu 16.04 LTE server
-
LAMP (Linux Apache / MySQL / PHP) has been installed
-
SSH has been enabled
-
A WordPress site has been installed
-
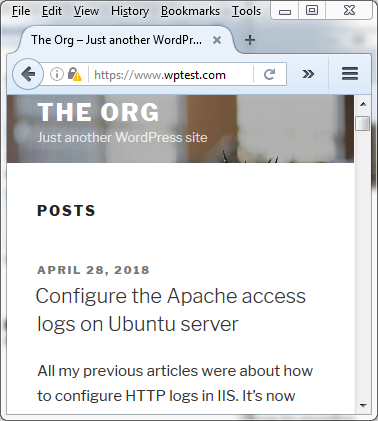
The WordPress site is accessible from a URL like www.wptest.com and wptest.com with redirection
-
HTTPS has been activated for the WordPress site
-
If the web site is accessed in HTTP a redirection occurs to HTTPS
This is a very basic WordPress site.
Log rotation
In the default configuration the web activity on the Apache server is stored in the file /var/log/apache2/access.log
So if you don’t do anything this file will keep growing and will be every time more difficult to consult. So the first thing to do is to configure the log rotation to store the log lines in a new file every day. This will allow archiving old log files and facilitate consulting the recent web activity.
The access log configuration is stored either in the Apache configuration file /etc/apache2/apache2.conf or in the virtual site configuration. By default you’ll have the following two virtual sites configuration files:
-
/etc/apache2/sites-available/000-default.conf (default HTTP site)
-
/etc/apache2/sites-available/default-ssl.conf (default HTTPS site)
In both files you have by default the following log directive
CustomLog /var/log/apache2/access.log combined
You’ll find more information on how to configure Apache log files and the CustomLog directive in the Apache log files documentation.
In order to put a log rotation in place we will pipe the log rows to the rotatelogs program (See the rotatelogs documentation) and as argument we will tell to rotatelogs in which folder to store the log files, how to name them and after how much time a new file needs to be created.
The following new CustomLog directive will rotate the log file everyday:
CustomLog "||/usr/bin/rotatelogs /var/log/apache2/site000/access/access-%Y-%m-%d.log 86400" combined
Before applying the new configuration we need to create the folder to store the log files of our web site
sudo mkdir /var/log/apache2/site000
And a folder to specifically store access logs for the web activity in case later we want to store error logs in a separate folder.
sudo mkdir /var/log/apache2/site000/access
Then we can change the virtual site configuration files:
sudo nano /etc/apache2/sites-available/000-default.conf
Replace the CustomLog directive with the new one mentioned before. Then save and exit (CTRL+O and CTRL+X)
Do the same with the https virtual site
sudo nano /etc/apache2/sites-available/default-ssl.conf
Now to apply the new configuration we restart Apache gracefully
sudo apache2ctl graceful
Then after some activity happened on the web server we can take a look at the just created log folder
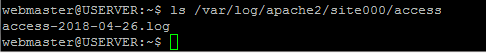
ls /var/log/apache2/site000/access
We see that a file with today’s date has been created.
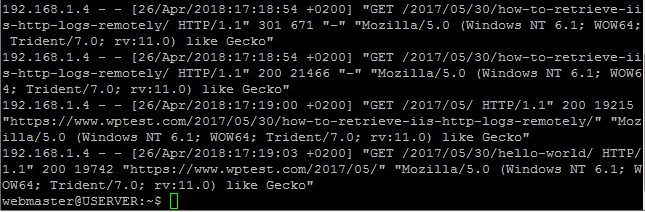
We can display the content of the file with the following command (replace the date in the command)
cat /var/log/apache2/site000/access/access-2018-04-26.log|tail
And we see this
Add additional fields
The logged fields are defined with the LogFormat directive in the /etc/apache2/apache2.conf configuration file. You’ll find hereafter the default LogFormat directives.
LogFormat "%v:%p %h %l %u %t \"%r\" %\>s %O \"%{Referer}i\" \"%{User-Agent}i\"" vhost_combined
LogFormat "%h %l %u %t \"%r\" %\>s %O \"%{Referer}i\" \"%{User-Agent}i\"" combined
LogFormat "%h %l %u %t \"%r\" %\>s %O" common
LogFormat "%{Referer}i -\> %U" referrer
LogFormat "%{User-agent}i" agent
In our CustomLog directive we use the combined format. This is a standard format that contains the client IP address, the used account if any, the date and time, the request (Method + path + query), the HTTP status, the number of bytes sent, the referrer and the user agent.
The variables used in the LogFormat directive are explained in the Apache logging module documentation.
A few important fields are missing from the combined log format.
-
You don’t have the time taken by the request to be served. This is important if you want monitor the performance of your web site.
-
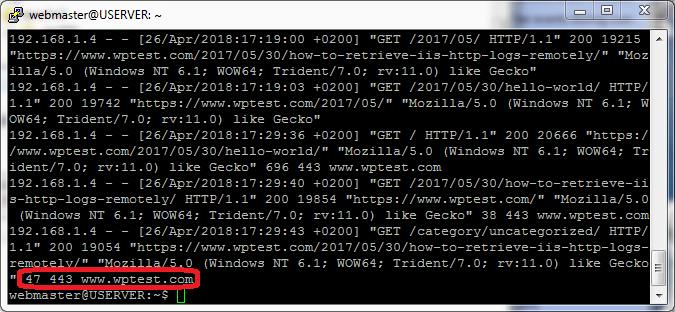
You don’t have the port used by the request. This is important if you want to differentiate HTTP (port 80) from HTTPS (port 443) requests. Of course you could put both in different log files instead as HTTPS is configured on a different virtual site. However if you want to follow SEO best practice to avoid duplicate content you will make any HTTP request on your web site automatically redirect to HTTPS. If both original HTTP requests and redirected requests are in the same file it will be easier to follow.
-
You don’t have the hostname entered in the browser. This is also important if you want to avoid duplicate content. For example you may choose to have your main URL with the www but also want that a request without the www is automatically redirected to the main URL. So if you have the hostname in the log file you will be able to monitor if these redirections are working as expected.
So now that we have selected 3 missing fields important for us we will create a new LogFormat directive. We start from the combined log format and add the new fields at the end. It’s important to add them at the end so any log tool that needs to parse the log file will still be able to extract the standard fields from the log line by just ignoring the end of the log lines.
We will add the following variables:
-
%{ms}T Time taken by the request in ms
-
%p Port used by the request on the server
-
%{Host}i Host name provided by the browser
So this leads us to the following new directive that creates a new log format named extended.
LogFormat "%h %l %u %t \"%r\" %>s %O \"%{Referer}i\" \"%{User-Agent}i\" %{ms}T %p %{Host}i" extended
We edit the Apache configuration file
sudo nano /etc/apache2/apache2.conf
We add the new LogFormat directive and then we save and exit.
Then we need to change the CustomLog directives in the virtual site configuration files to use this new extended format.
CustomLog "||/usr/bin/rotatelogs /var/log/apache2/site000/access/access-%Y-%m-%d.log 86400" extended
First we edit the HTTP virtual site configuration file
sudo nano /etc/apache2/sites-available/000-default.conf
In the CustomLog directive replace combined with extended. Then save and exit.
Then we edit the HTTPS virtual site configuration file
sudo nano /etc/apache2/sites-available/default-ssl.conf
In the CustomLog directive replace combined with extended. Then save and exit.
Now to apply the new configuration we restart Apache gracefully
sudo apache2ctl graceful
Then after some activity took place we can display the last lines of the log file (replace the date in the following command)
cat /var/log/apache2/site000/access/access-2018-04-26.log|tail
And we can see the new fields
Access logs remotely
Analyzing the logs directly on the server is a little difficult so we will see now how we can retrieve them remotely.
Access logs remotely with the admin account
As SSH is enabled it’s very easy to access the log folder through the SFTP protocol by using FileZilla for example.
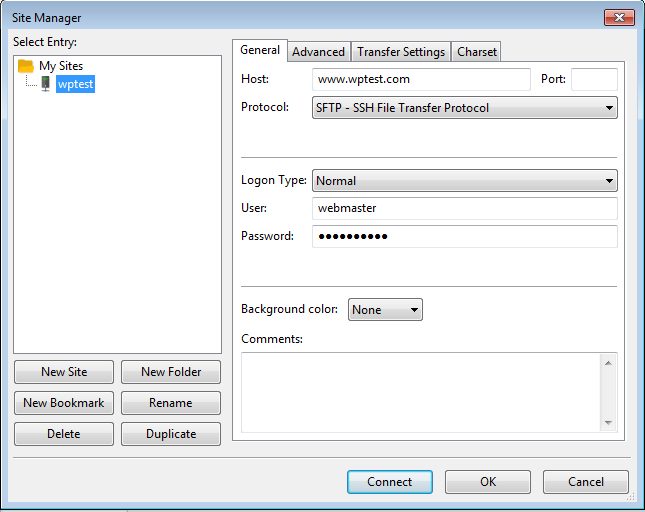
In FileZilla we create a new site in the Site manager.
-
Specify the web site hostname as host
-
Select SFTP as protocol
-
Select Normal as Logon type
-
And specify the credentials of your admin account
Once connected you can browse the whole server folder tree and you can retrieve more specifically the content of the log folder.
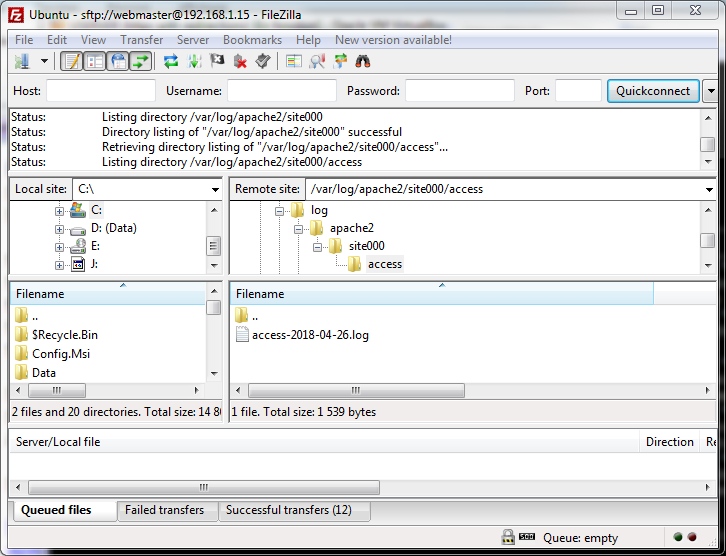
However only an admin account (member of the adm group) can retrieve the logs this way. If the user is not member of the adm group he gets an access denied when trying to access to /var/log/apache2.
Share the log folder for a less privileged account
You may want to allow an auditor from outside your organization to access the logs. So you cannot give him the credentials of an account with access to the whole folder tree and with shell access.
So to work around that we will create a specific account only allowed to read the content of the log folder.
It’s possible with SSH to share a specific folder without access to anything else. However there is a condition for this folder. Root must be the owner of the folder and of all parent folders. Unfortunately that’s not the case for folders inside /var/log/.
We don’t want to alter permissions in /var/log/ to avoid any problems with the system logging. So we will create instead a symbolic link to access the log folder from the folder /var/www/ were the web site root folder is already located. This folder has the required permissions by default.
To do that we execute the following command:
sudo ln -s /var/log/apache2/site000 /var/www/logs
We can check that the link is working
ls /var/www/logs/access
And we can see the content of the web site log folder from the new location

Now that the log folder is ready to be shared we create a user named log-guy
sudo adduser log-guy
Once the user is created we edit the SSH configuration
sudo nano /etc/ssh/sshd_config
We add in the configuration file the following lines that will only allow the log-guy account to access the log folder.
Match User log-guy
ForceCommand internal-sftp
PasswordAuthentication yes
ChrootDirectory /var/www/logs
PermitTunnel no
AllowAgentForwarding no
AllowTcpForwarding no
X11Forwarding no
We can then save and quit and restart the SSH service to apply the new configuration
sudo systemctl restart sshd
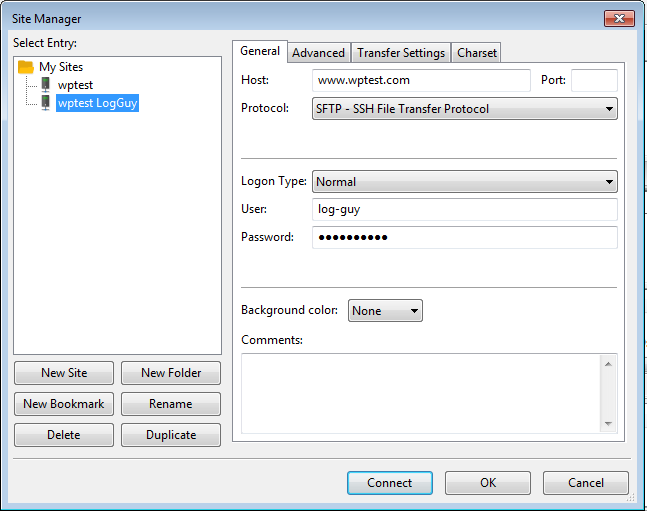
We are now ready to do a test with FileZilla
We create a new site with the same settings but with the log-guy account credentials
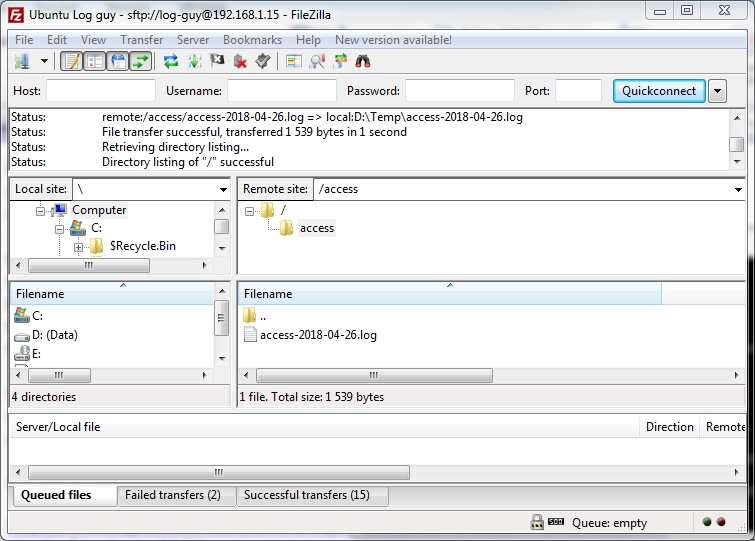
And when we connect we see that we land directly in the log folder without any way to go to a parent folder. And we can see our log files in the access subfolder.
Synchronize logs
Now that you can access Apache logs remotely you may not want to regularly retrieve new log files manually. To do that you can use some free synchronization tools that support the SFTP protocol.
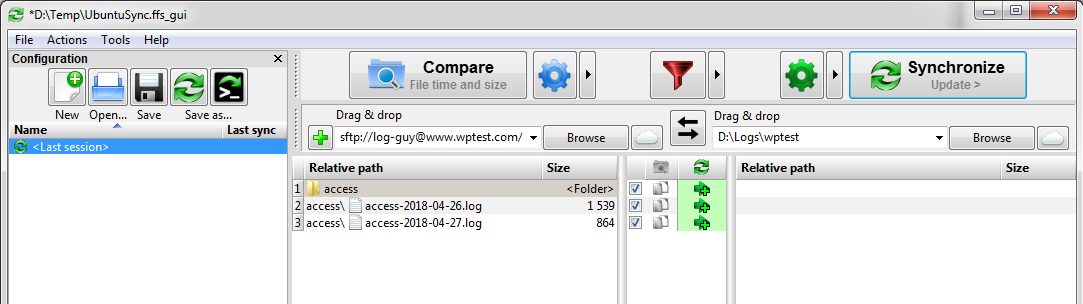
For example FreeFileSync will do the job.
If your workstation is on Windows you can also use the LogSync command line tool presented in a previous article.
The main advantage of this tool is that only the increased part of the log file will be retrieved. So if you need to get the latest web requests several times in a day it will avoid downloading every time the whole file saving bandwidth and speeding up the synchronization.
For the occasion the support of the SFTP protocol has been added to the tool. Please refer to the article for a full explanation on this tool.
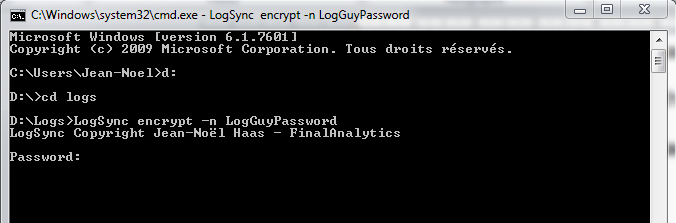
First run the following command to store the password
LogSync encrypt -n LogGuyPassword
You are then prompted to enter the password that will be encrypted and saved under the name LogGuyPassword.
Then launch the following command to start the synchronization. The destination folder (e.g. d:\Logs\wptest) needs to be created first.
LogSync sftpsync -h www.wptest.com -l d:\Logs\wptest -r /access -u log-guy -p LogGuyPassword
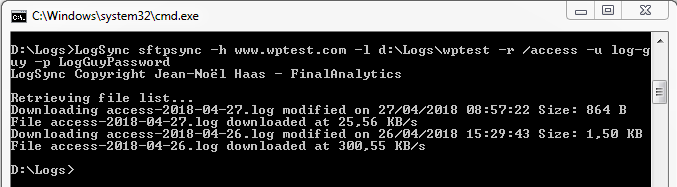
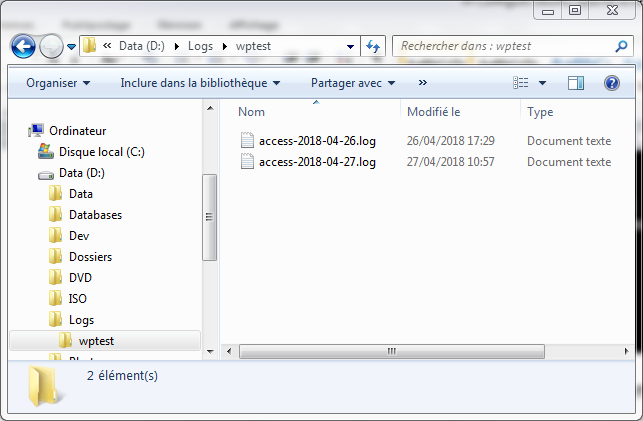
We now have our log files on Windows and it is very easy to keep them synchronized by launching a batch.
Analyze the logs
Now that we have all logs on our workstation we can start analyzing them. If you are on a Windows workstation you can use the free edition of the HttpLogBrowser.
Download it from this link. Make sure you have the just released version 2.0.0.11 (or more) that fixes some issues with Apache logs and adds the support of the three fields we added previously.
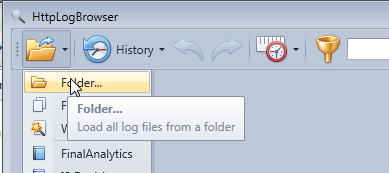
Once installed and launched go in the Files menu, select Folder and browse for the local log folder.
Once the log files have been processed you can see the log rows in the application. In particular you clearly see that the port and host fields have been correctly parsed and you see that requests to the port 80 or host wptest.com are redirected to the canonical URL https://www.wptest.com.
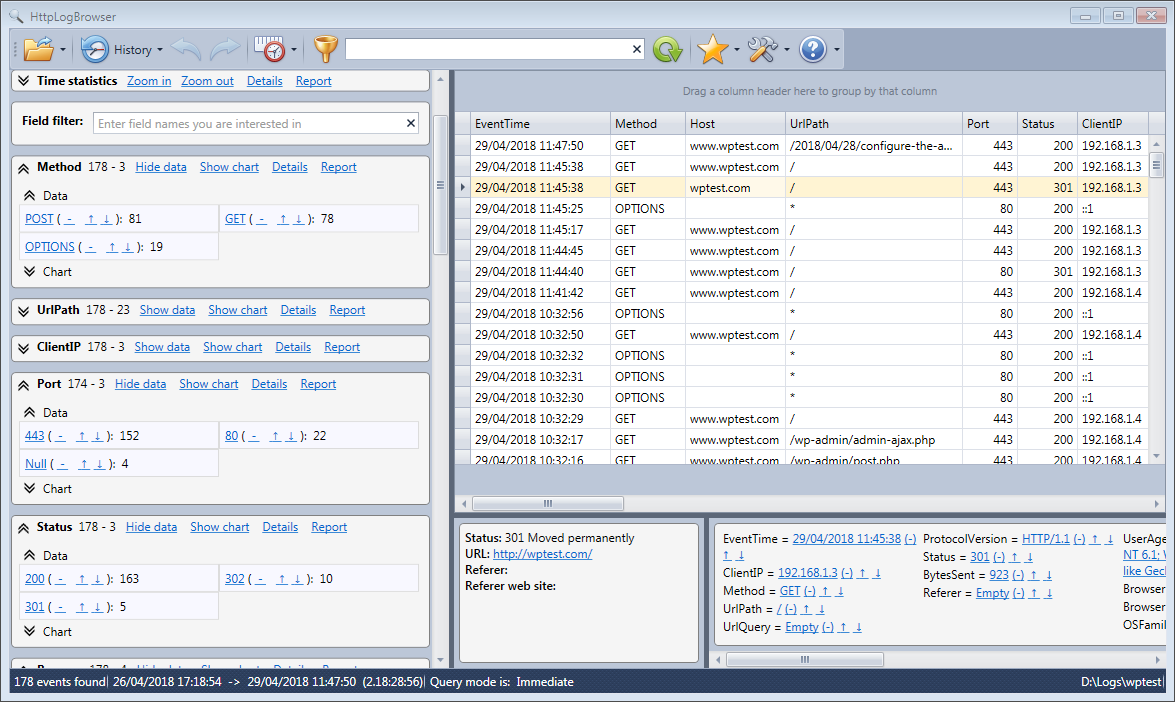
To continue further the analysis you could for example click on the value 80 in the Port statistics to check if all http requests are correctly redirected.
You can also see that the TimeTaken field was also retrieved. In the field statistics panel you can see a histogram like hereafter that will allow you to verify the response speed of your web site:
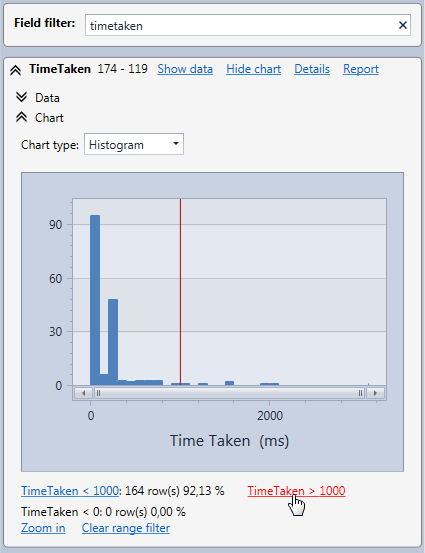
You can easily filter on the slowest requests by clicking at a specific position in the histogram to move the cursor and then click on the link TimeTaken > X below the chart.
You see that the HttpLogBrowser makes it very easy to filter on specific field values to only display the web requests you are interested in. I’ll let you discover by yourself all the features of this tool.
Conclusion
You learned in this article how to configure Apache access logs on an Ubuntu server and more specifically how to configure the log rotation, how to add custom fields and how to share the log folder to retrieve the log files from a remote workstation. Then you also learned how to easily synchronize these log files and how to analyze them from a Windows machine with the free edition of the HttpLogBrowser.
References: