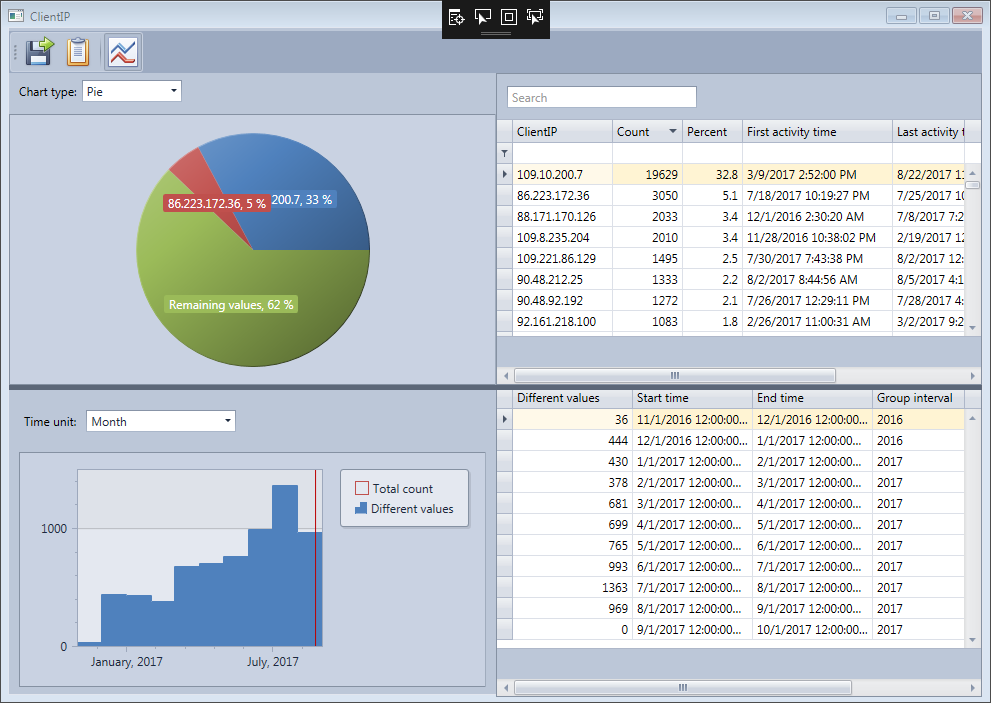
You can access this window by clicking the Details link in the header of the concerned field section in the Field statistics panel.
You will see here all values appearing for the field in the view. For each value you will see the statistics, the percentage, the first time the value appears in the log rows, the last time and the duration between both times.
You can easily find a specific value in the data grid with the search box.
•The statistics data grid can be exported with the export button. (Professional edition only)
•You can switch from Pie chart to Top 5 chart with the Chart type selection box on top of the chart.
•If the field is numeric you can also select Histogram as type. If you do that you will see range of values in the data grid instead of values.
•With the Report button you can display a printable report with the chart and statistics of the concerned field. (Professional edition only)
•The Evolution button allows to display/hide a second section showing the evolution of the number of different values by unit of time or the evolution of the average value or sum if the field is numeric. The time unit can be changed with the selection box on top of the evolution chart.
•Optionally you can select Total count in the evolution chart to display the evolution of the number of web requests by unit of time (Time Statistics) and compare it with the evolution of different values.
•The evolution data can also be exported by right clicking in the data grid and selecting Export. (Professional edition only)
