Professional edition only!
Statistic reports
You can display a printable report of statistics from several fields by clicking on Statistics report in the Tools menu.
You are then prompted to select the fields you are interested in. Once selected click OK.

The report is then displayed in a new window.
For each field you will see either a pie char or a top 5 values chart or a histogram if the field is numeric. After the chart you will see the top 20 values list with their statistics or for numeric fields you will see the list of value ranges instead.
Optionally you may have a second section with the evolution in time of the number of different values or if the field is numeric the evolution of the average value or the sum depending on the field. The fact that the evolution is displayed for the field can be configured in the Detailed field statistics window of the concerned field.
If the log rows grid is grouped, the reports will also be grouped and you will see statistics for each value of the first grouping field.

In the report viewer window you can click on the Print button to print the report or click on Export to save the report in a PDF file.
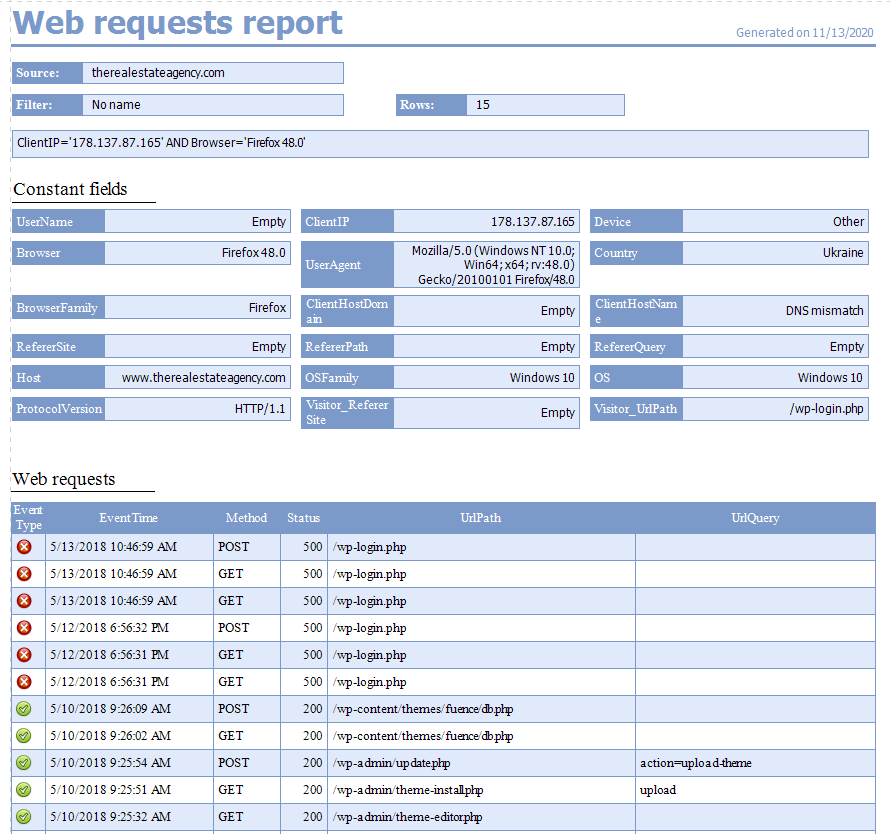
Web requests reports
You can also generate a printable report of filtered web requests displayed in the view by clicking on Web request report in the tools menu..
The six first columns of the view are automatically included in the report and the column widths in the report are based on the column widths in the data grid. So to customize columns in the report you just need to move around and resize columns in the datagrid. The report header also shows the filter settings, all constant fields with their value and the list of fields that are always null.