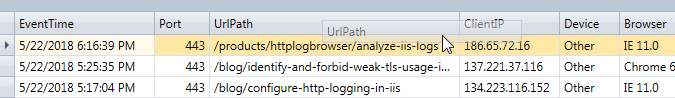
Once all log files are loaded the filtered rows are displayed in a grid.
Context menu
If you right click on a cell of the grid you will be able to directly filter the view on this value or filter out this value from the grid or go to the next/previous row with the same value in the field. You will also be able to copy the cell value in the clipboard to paste it in another application.
The Next/Previous function are also available through shortcuts (CTRL+Up and CTRL+Down)
The context menu will also allow you to display the web page concerned by the web request in a web browser (Navigate to web page) and if there is a referer mentioned you can do the same with the referer web page or the referer web site.
The web page URL is reconstructed with several fields: UrlPath, UrlQuery and Host. If the field Host is missing the host name provided in the Analysis settings will be used. If not provided in this case the navigation will not work.
The context menu also allows you to export the content of the data grid (Professional edition only).
Selected row panel
When a row is selected it is highlighted and you see information concerning the row in the panel below the grid. At the left you see more important fields with links to browse the web page or the referrer and if the tracking mode is enabled you also see the links to the landing request and the original referrer from which the visitor came from. At the right you see the list of variable fields with their value (constant fields are showed in the constant fields panel). If you click on a value you filter further the view on this value. You can also filter out the value with the - link or go to the next/previous row with the Up/Down links.

Columns
If the setting Show/Hide columns manually is not selected in the Preferences, columns with always the same value throughout the filtered view are hidden in the grid and the constant value is displayed in the Constant fields panel. If for any reason you want to restore a hidden column or hide a displayed column you can do that by right clicking on a column header and by showing the Column chooser.

From the Column chooser you can then drag and drop fields to restore in the columns header or counter-wise drag and drop fields to hide from the columns header to the Column chooser.

It is also possible to group by a specific field with a drag and drop of the column header in the group panel.

With the professional edition statistics reports will be grouped with the the first grouping column of the grid.
If you want to remove the grouping just right click on the field in the group panel and click on Ungroup.
It's also possible to change the column order with a drag and drop.
Sort
By default the log rows are ordered by time from newest to oldest. If you want you can order by another field just by clicking on the column header of the field. You will then see an up/down arrow indicating the sort direction.

If you want to cancel the sorting, right click on the column header and click on Clear sorting.
Filter
You can also filter directly in the data grid by clicking on the funnel right to the field name and selecting a value in the drop down list.

However you need to keep in mind that this is a post filter and has nothing to do with the filter specified in the filter box and will not impact the displayed statistics. So use it only adequately.
Selection mode
Professional edition only!
The grid supports the following three selection modes (can be changed in the Preferences):
•None: Only one row can can be selected. Unique mode of the free edition.
•Row: You can select several rows by keeping the CTRL key or the SHIFT key down when you click on rows. Default mode for the professional edition.
•Cell: You can select several cells by keeping the CTRL key or the SHIFT key down when you click on cells.
Selected rows/cells can then be copied in the clipboard in order to be paste in another application like MS Excel for example.