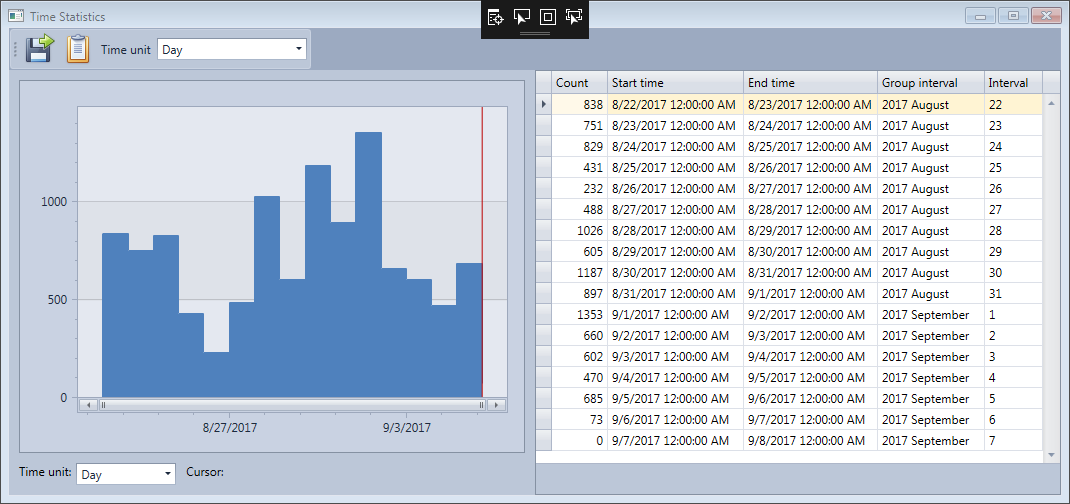
You can display this window by clicking the Details link in the header of the Time statistics section in the Field statistics panel.
In addition to the evolution chart you will see a data grid with the corresponding evolution data. Each line will represent a time interval with the number of web requests in the time interval.
•The time unit can be changed with the Time unit selection box.
•You can export the data grid in a file. (Professional edition only)
•You can display a printable version of this view by clicking on the Report button. (Professional edition only)
