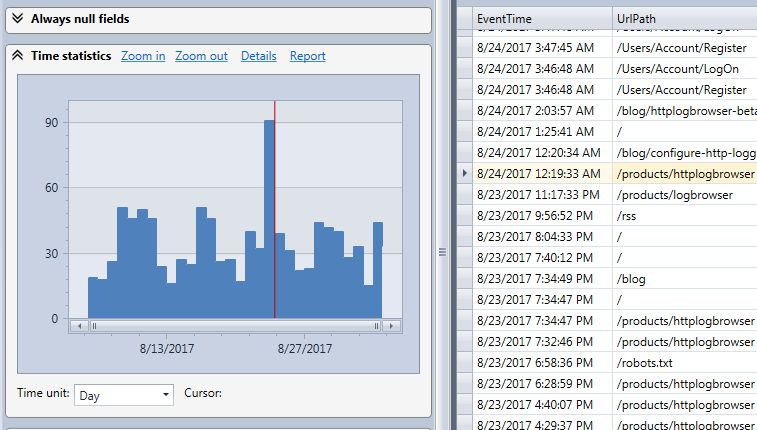
The time statistics chart displays the evolution of the number of web requests by time interval.
See how to use it in the getting started guide.
If you need the evolution of the number of request you in a grid can click on Details in the header.
With the professional edition you can display a printable version of the Time statistics by clicking on the Report link.
