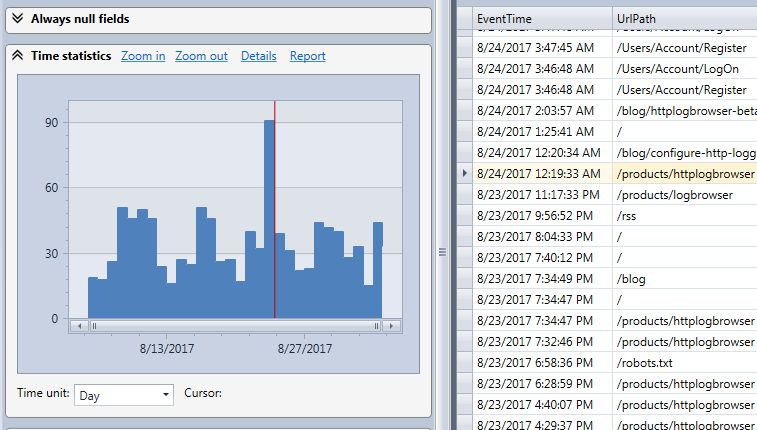
If you expand the Time statistics panel you will see a chart with the evolution of the number of web requests by period of time.
With the mouse wheel you can easily zoom in the chart if you need a better time resolution or if you are interested in a specific period. Once you reached the maximum zoom level you can click on the Zoom in link to filter the entire view according to the time frame visible in the chart. Then you can zoom in the chart again with the mouse wheel.

Also when you move the mouse over the chart you see a cursor and a tool tip indicating the position and the statistics for the period. The position of the cursor is also indicated more precisely below the chart.
You also see a second red cursor indicating the position in time of the selected log row in the grid. If you selected another log row the red cursor will move accordingly. If you double click on a bar in the chart the nearest log row will be automatically selected in the grid.
Next step: Display and use charts