In the IIS HTTP logs a field TimeTaken is logged with the time in milliseconds necessary to answer to the web request. The Apache access log doesn't contain this field by default but if you add it exactly as explained in this article the application will be able to extract it.
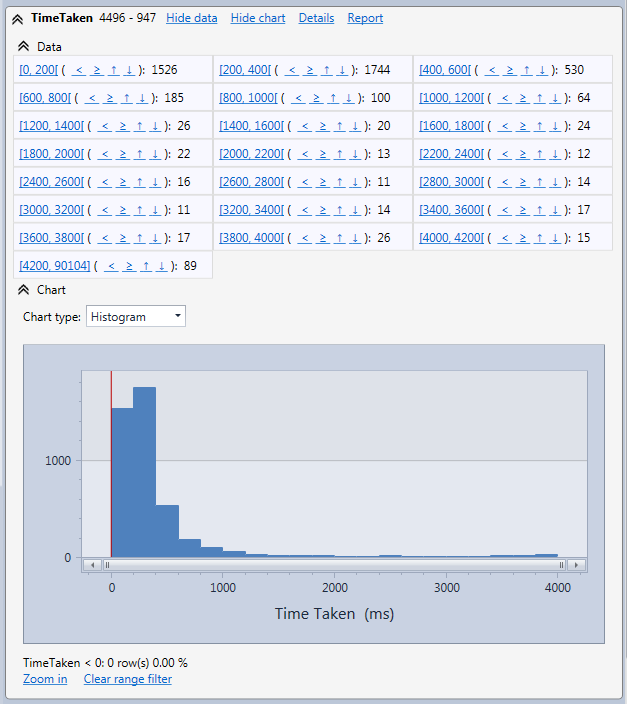
In the following screen shot you see an example on how the time taken can be distributed.

You see that there is a peak around 300 ms. This give us an indication of the average response time. However we also see that there is a tail of values around 4 s. The reason for that is that a web site may propose big files to download and when a big file is downloaded the time to send the file is limited by the bandwidth between the server and the client but not by the server performance.
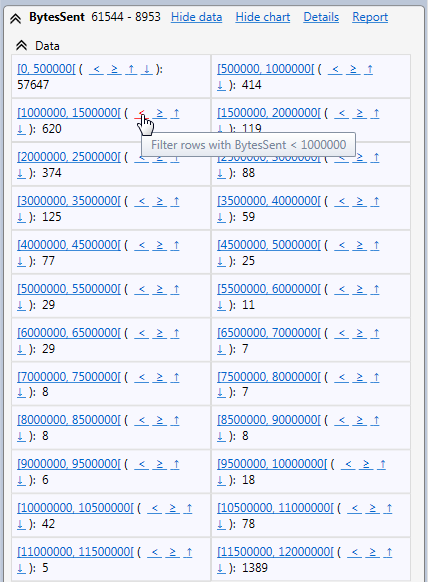
In order to confirm that, we can take a look at the ByteSent field. In the following screen shot showing the ByteSent field for the https://www.finalanalytics.com web site and we see in the range 11500000 to 12000000 bytes a big number of requests corresponding to the download of the HttpLogBrowser setup file.

If we want to monitor the server performance we can remove big files download requests by clicking on the < link on for example the 1000000 to 1500000 interval. This will give us requests sending less than 1 MB. The filter will then be like this:
BytesSent<1000000
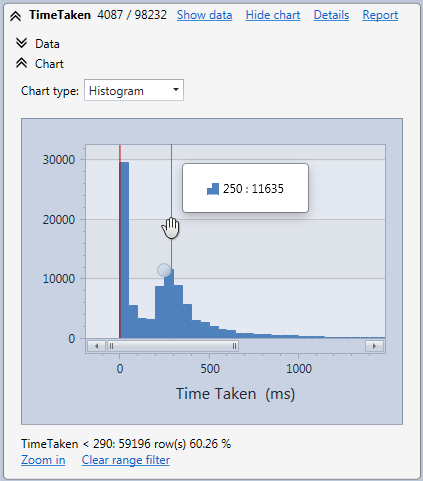
Now if we take a look again the TimeTaken histogram we see that the tail is less important showing us the real performance of the server. If we zoom in the beginning of the histogram we may see something like in the following screen shot.

In the case of the https://www.finalanalytics.com web site we see two peaks. One very close to 0 meaning requests are treated very quickly (less than 100 ms) and a second peak around 250 ms. How can we explain this? The answer is simple. Web servers have generally a web requests cache. When the answer to a request is already in the cache the web server can answer it very quickly. This corresponds to the first peak. If the answer is not in the cache the server needs to calculate it and it takes more time. This is the second peak.
Of course the interpretation of the shape of the TimeTaken histogram may be different for each site. For example several sections of a web site can be built with different technologies with different answer time leading to a more complex shape. This is just an example of what you could see.
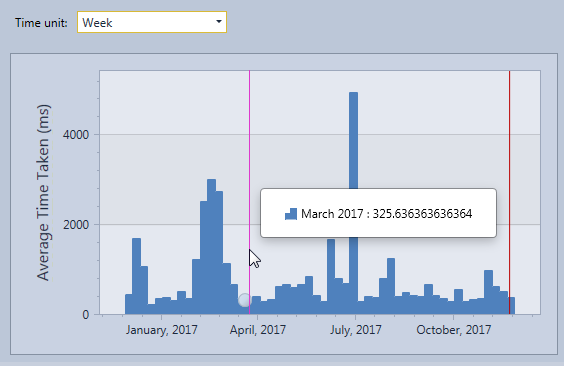
All we saw until here is an average behavior over a period of time but we may also be interested in following the evolution of the average answer time. To do that we can click on the details link and then in the detailed field statistics window we can see the following chart showing us the evolution of the average answer time.

We see when the web site is at its best around 300 ms and from time to time the average answer time is less good and there may be something to investigate.